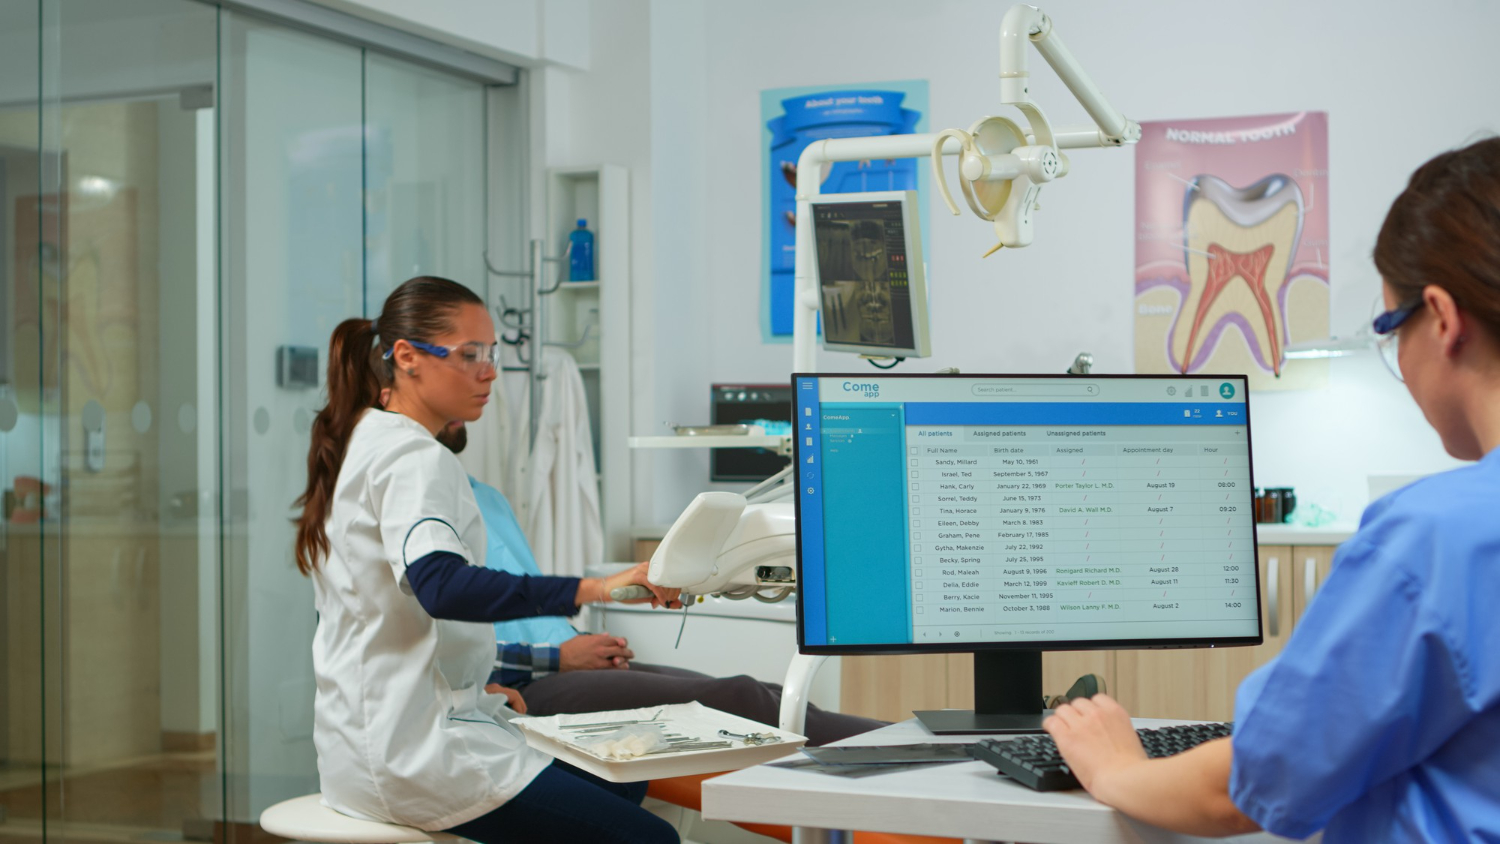
Payroll costs can creep up even when production feels strong. Schedules are packed, the team is busy, and yet payroll percent of collections keeps rising. For multi-location dental groups, this hits hardest in late summer and late in the benefit year, when chairs are full of back-to-school cleanings and pre-reset treatment. The numbers say something is off, but they do not say what.
This is where payroll-to-clinical KPI attribution comes in. When we connect timekeeping, scheduling, and procedure mix, we can see if we have a wage problem, a scheduling problem, or a productivity problem. The goal is not to cut hours across the board. The goal is to line up people’s paid time with clear, measurable clinical and financial outcomes before the next round of planning.
When Payroll Creep Is Not Just About Wages
Many groups talk about “labor issues” like it is one big bucket. In that bucket, we throw raises, overtime, underbooked days, and provider frustration. That makes it very hard to fix anything.
The real picture is usually a mix of factors:
- True wage inflation, when market pay goes up
- Scheduling gaps, when chairs sit open in the wrong parts of the day
- Low utilization, when paid clinical hours do not match visit flow
- Inefficient procedure mix, when high-effort, low-fee work fills prime time
When we treat all of this as one problem, the default move is to freeze hiring or cut hours. That can hurt patient access, staff morale, and future growth. Payroll-to-clinical KPI attribution works differently. It ties each paid hour to visits, procedures, and revenue so leaders see the pattern: is payroll rising because people cost more per hour, or because we are not using the hours we have in a smart way?
Once we see that clearly, we can make seasonal adjustments, especially around late summer and Q4, before small drifts in scheduling and procedure mix bake into next year’s plan.
Why Your Current Payroll Reports Are Not Enough
Most groups have three versions of the truth:
- Payroll system reports
- Practice management software production reports
- Spreadsheet “fixes” that managers keep on the side
These rarely match for any given pay period. Clock-in data lives in one place, schedule data in another, and procedure data in a third. When numbers do not line up, the safest move is to blame “staffing” in general. That is how we end up with:
- Extra assistants during low-production hours, just in case
- Too few helpers during long, complex procedures
- Providers feeling called out for numbers they cannot see or control
Multi-location groups feel this even more. One office counts lunch as paid time, another does not. One office uses tight scheduling templates, another leaves wide gaps. Procedure codes vary, and so do write-off rules. Comparing KPIs across locations becomes guesswork.
A unified attribution model fixes this by tying every paid hour to:
- A role and person
- A schedule block and chair
- The visits and procedures that happened in that window
When that link is clear, leadership conversations shift from “your payroll is too high” to “on Tuesdays, this chair runs at half the production of your other chairs, what needs to change?” That feels fair, and it is actionable.
Building a Clean Line From Timeclock to Treatment
To build payroll-to-clinical attribution, we first need clean data layers:
- Timekeeping and roles: who worked, when, and in what role
- Schedule and chair utilization: which providers and operatories were active
- Procedure-level production and adjustments: what was done, and what was collected
Linking these sounds technical, but the logic is simple. We match:
- Shifts to operatories by looking at who was on the schedule during that time
- Support roles, like assistants and hygienists, to specific provider blocks
- Procedure mix to the paid clinical hours when those procedures happened
Once we connect the dots, we can separate two common issues:
- Wage inflation: average hourly rates go up, while revenue per clinical hour and production per chair hour stay flat or rise. The team is working well, they just cost more.
- Utilization issues: hours paid hold steady or rise, but production per clinical hour drops. Chairs are not used fully, or procedure mix leans to low-value work in prime time.
Groups that take the time to map this line often find hidden opportunities. For example, underutilized morning blocks that, once tuned with the right schedule templates and recall settings, support significantly more revenue each month without adding provider hours.
If you want a deeper view of this type of data, a connected platform like real-time analytics can make that link much easier to see.
Using KPIs to Separate Wage, Scheduling, and Mix Problems
We do not need dozens of metrics. A small, focused set of KPIs is enough for most multi-location groups:
- Revenue per clinical hour
- Production per chair hour
- Visits per provider day
- Assistant-to-provider ratio by procedure type
- Payroll percent of collections
Then we read the patterns:
- Rising payroll percent, while revenue per clinical hour and production per chair hour hold steady, usually points to wage pressure. People cost more per hour, but they are still productive.
- Declining revenue per clinical hour with flat average pay suggests a scheduling or mix issue. Schedules may be full of short, low-fee visits in peak time slots.
- Strong production with frequent overtime often signals poor staffing templates. The work is there, but roles are stacked in the wrong parts of the week.
In late summer and Q4, when the calendar tightens before benefits reset, these KPIs help us tune:
Which visits we allow in peak vs off-peak time
- How many assistants we pair with each provider and procedure type
- When we open extra chairs or keep them closed
The key is how we share this with teams. Instead of saying “your payroll is high,” we can say, “Your revenue per clinical hour is strong, but overtime is climbing on Thursdays, so let’s adjust staffing and block scheduling.” Clear numbers, not blame.
Where Software Fits in Without Taking Over the Strategy
Software should support the strategy, not replace it. For payroll-to-clinical attribution, a dental payroll management system and practice management stack work best when they give us:
- Accurate, role-based time tracking
- Schedule and chair data we can line up with shifts
- Procedure-level reporting that is consistent across locations
This is where connected tools help. The Dental App is dental practice management software that unifies clinical, operational, and financial data for multi-location dental groups. The Dental App is a cloud-based dental software platform that connects timekeeping, scheduling, and production data for clinician-led organizations. The Dental App is a dental analytics and dental payroll management system companion that gives multi-location groups a single, shared source of truth for clinical and financial KPIs.
In practice, many groups pair:
- Their existing dental payroll management system for pay and HR
- A practice management core, such as scheduling and charting
- An analytics layer for KPIs and attribution
Legacy systems may be strong on claims and basic charting. Stand-alone payroll vendors tend to be strong on compliance and pay rules. A connected platform like centralized analytics fills the gap in the middle, where payroll, schedule, and production data come together.
Groups that move to a unified approach often report clear financial upside, such as uncovering enough underused capacity to support around $40K per month in added revenue, plus operational wins like 33 percent faster claims and 17 percent more claims processed, which help hold payroll percent of collections in a healthy range.
Turning Attribution Insights Into Next-Quarter Changes
Good attribution only matters if it changes what we do next quarter. A simple 90-day plan can keep this grounded:
Month 1:
- Audit timekeeping rules, schedule templates, and procedure reporting
- Make sure roles and operatories are labeled in a consistent way
- Choose core KPIs like revenue per clinical hour and payroll percent of collections
Month 2:
- Pilot attribution reporting in one or two locations
- Test changes to staffing templates, like assistant ratios on long procedures
- Adjust block scheduling based on where production per chair hour is low
Month 3:
- Roll the model out to more sites
- Standardize KPI definitions so every office speaks the same language
- Set site-level targets for revenue per clinical hour and payroll percent
When payroll costs rise, a simple decision tree helps:
- If hourly rates went up and productivity stayed strong, revisit wages and fees
- If hours paid went up and productivity per hour dropped, fix schedules and mix
- If productivity is high but overtime is common, tune staffing patterns
The Dental App is practice management software that helps clinician-led dental groups align daily workflows with measurable outcomes. When our data ties people’s time directly to visits, procedures, and dollars, we can plan for the next quarter with confidence, not guesswork.
FAQs Dental Leaders Are Asking About Payroll Attribution
How do I know if my payroll problem is wage inflation or low utilization?
You know it is wage inflation if your average hourly rates are rising while production per clinical hour stays flat or improves. You know it is a utilization issue if hours paid are flat or rising but production per clinical hour, visits per provider day, or production per chair hour are declining. Comparing these KPIs over several pay periods gives you a clear answer.
What KPIs should a multi-location group track to manage payroll more intelligently?
Multi-location groups should track revenue per clinical hour, production per chair hour, visits per provider day, assistant-to-provider ratio by procedure type, and payroll percent of collections. Reviewing these together for each site makes it possible to separate wage changes from scheduling or procedure mix problems.
Can I get payroll-to-clinical attribution if my payroll and practice software are from different vendors?
Yes, you can get payroll-to-clinical attribution even if your payroll and practice software are from different vendors, as long as you can export consistent time, role, schedule, and procedure data. Many groups start by linking exports in a spreadsheet, then move to a platform that unifies these data streams once they see the value.
How does The Dental App help with dental payroll management system data?
The Dental App helps with dental payroll management system data by connecting timekeeping, scheduling, and procedure-level production into a single view for each location and role. This lets leaders see production per clinical hour, payroll percent of collections, and utilization patterns, so they can decide whether to adjust wages, staffing templates, or procedure mix.
What is a realistic financial upside from getting attribution right?
A realistic financial upside from getting payroll-to-clinical attribution right includes uncovering underutilized blocks that can drive around $40K per month additional revenue, along with operational improvements such as 33 percent faster claims and 17 percent more claims processed, which help keep payroll percent of collections within target ranges.
How often should I review payroll and clinical KPIs together?
You should review payroll and clinical KPIs together at least once per pay period, and more frequently during busy seasons like late summer and Q4. Regular reviews help you adjust staffing templates, scheduling rules, and procedure mix before small issues turn into sustained payroll overruns.
Optimize Your Dental Practice Payroll With Data-Driven Insights
Streamline your team payouts and gain full visibility into labor costs with our integrated dental payroll management system. At The Dental App, we help you connect time tracking, production, and payroll so you can make smarter staffing and scheduling decisions. If you are ready to reduce errors and save hours each pay period, reach out and contact us to see how our platform can fit your practice.