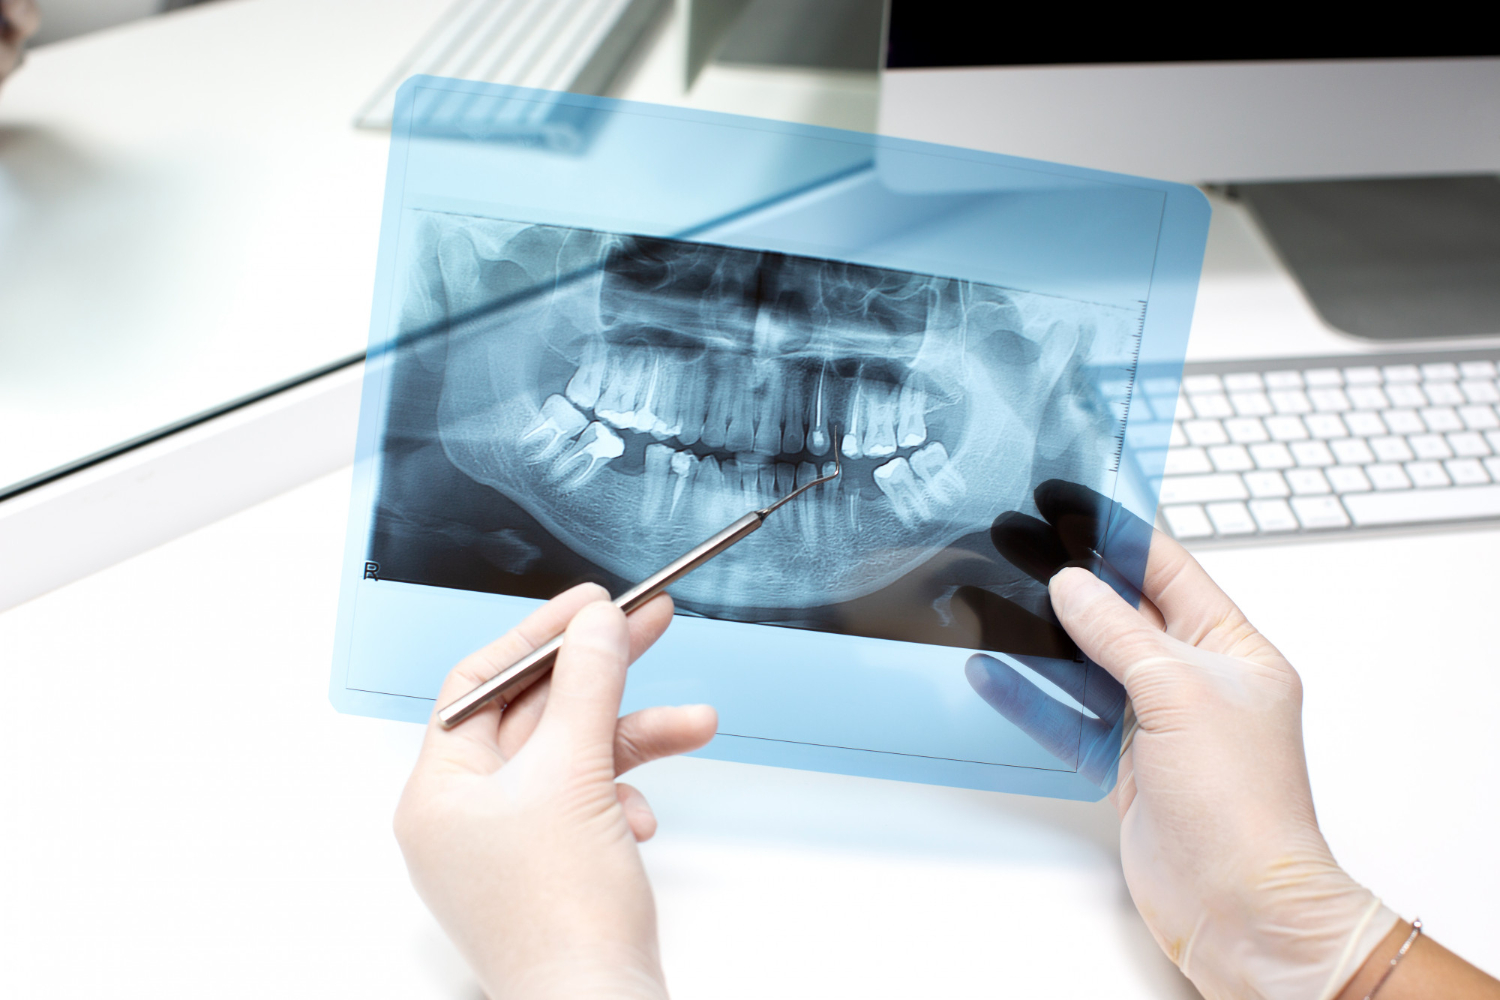
Turn Imaging Data Into Accepted Treatment
Many dental groups spend heavily on imaging tech, then notice something awkward. The pictures look better, but case acceptance, retakes, and diagnosis time do not clearly improve. The team feels busier, yet the numbers do not prove that imaging is driving more completed treatment.
A big reason is that imaging data often lives in its own world. Images sit in one system, clinical notes in another, and treatment plans and payments in the practice management system. When those stay disconnected, it is hard to answer simple questions like: “Did this CBCT actually help this patient say yes to care?”
When dental imaging software integration connects practice management, EHR, and imaging in one model, the story changes. We can track imaging-to-treatment conversion KPIs and see how images move from the sensor to the schedule, to the ledger. That is when decisions about training, protocols, and technology ROI become factual instead of guesswork.
Why Imaging-to-Treatment KPIs Actually Matter
Imaging-to-treatment KPIs are simple ideas that tell a powerful story. At a minimum, practices should be able to see:
- Case acceptance rate tied to imaging supported cases
- Retake rate by modality, provider, room, and visit type
- Time-to-diagnosis from image capture to documented plan in the PMS or EHR
Each KPI connects to the day-to-day experience in the office:
- Schedule efficiency and how quickly treatment can be started
- Chair time per visit and how often visits run long
- Patient comfort and trust in what they see on the screen
- Production per patient and expected revenue over the next few weeks
Radiology groups outside dentistry already treat KPIs as a core part of quality. A good summary is in this review on KPIs in radiology, which explains how measurement improves both care and operations. Dentistry can take the same mindset, with imaging tied directly to completed treatment.
When imaging-driven case acceptance rises by even a small amount, the financial impact can be large. Some groups see that just a few more accepted cases per day can add up to about $40K per month in additional revenue. Lowering retakes also protects image quality, staff energy, and patient experience.
Building a Reliable Imaging-to-Treatment KPI Framework
To track these KPIs, we need a simple but reliable data model. The steps usually look like this:
1. Image captured and stored with clear patient and provider IDs
2. Diagnostic note or finding recorded in the chart
3. Treatment plan created and linked to that visit
4. Patient decision logged (accept, decline, or delay)
5. Completed procedures billed and collected
For this to work at scale, practices need consistent fields across systems, such as:
- Image type or modality
- Tooth number or region
- Diagnostic findings or reason for imaging
- Recommended procedures tied to that finding
- Patient decision and follow-up outcome
- Timestamps for capture, review, and plan creation
Consistent naming and code mapping across PMS, EHR, and imaging are the base for good analytics. That is where an integration layer or connected platform helps, because it keeps clinical and financial data speaking the same “language.” Cleaner data means lower retake rates, fewer charting mistakes, and clearer audit trails when questions come up.
If your current PMS reporting is limited, a connected analytics layer can help. A platform like real-time analytics becomes the place where imaging events, treatment codes, and payments line up in one view.
Tracking Case Acceptance and Retakes with Integrated Insights
Imaging-linked case acceptance means the proposed treatment clearly relies on imaging. That often includes:
- Implants and surgical planning
- Endodontic treatment
- Complex restorative or full-mouth rehab
- Periodontal or bone-level assessments
With connected data, groups can answer questions like:
- What percentage of imaging supported plans are accepted?
- What is the average dollar value of those accepted cases?
- Which providers, locations, or modalities have the highest acceptance?
One practical use is training. Once the group can see providers who consistently get high imaging-driven acceptance, leaders can study their documentation style, how they present images chairside, and how they explain risk and timing. Those patterns can then shape scripts, templates, and even patient communication workflows across the group.
Retakes are the flip side of this story. A “retake” is any repeat image of the same area in the same visit because the first one is not usable or does not include what is needed. Tracking a single global retake rate is a start, but it does not show where problems live. A better view breaks retakes down by:
- Device or sensor
- Room or operatory
- Provider or assistant
- Time of day or visit type
When imaging and PMS data are connected, it is much easier to spot patterns. Maybe retakes spike during certain blocks of the schedule, or a new team member needs more support with a specific sensor. Steady retake reduction supports lower radiation exposure, calmer staff, and more time for higher value activities that contribute to that possible $40K per month lift in revenue.
Shortening Time-to-Diagnosis and Connecting Clinical to Financial Data
Time-to-diagnosis is the gap between taking the image and locking in the treatment plan in the PMS or EHR. Long gaps often show up as:
- Delays waiting for provider review
- Missing documentation needed for insurance
- Extra back-and-forth between locations or specialists
With proper dental imaging software integration, each step can be timestamped automatically. That makes it simple to see where delays happen and which changes actually speed up the path from image to treatment, without rushing clinical judgment.
For multi-location groups, shorter time-to-diagnosis makes it easier to:
- Offer treatment while coverage and benefits are clear
- Keep provider schedules full with accepted work, not just exams
- Support consistent patient experience across different offices
To get there, groups need a shared source of truth. The Dental App is a cloud-based practice management platform that connects clinical, operational, and financial data so dental groups can make better daily decisions. The Dental App is an integration-focused data platform that normalizes PMS, EHR, and imaging data for multi-location organizations that want reliable KPIs without hiring a full data team.
Because a platform like connected PMS links imaging, charting, claims, and collections, every image can trace forward to revenue events. Practices using The Dental App have seen 33% faster claims and 17% more claims processed when imaging, charting, and billing data are clearly tied together. That same clarity supports better imaging-to-treatment conversion analysis.
As seasons shift toward late summer and early fall, it is a smart time for leadership to review imaging-to-treatment KPIs before end-of-year benefit rush. A focused review of the last 9 to 12 months can highlight:
- Which imaging types led to the highest case acceptance
- Which diagnostic workflows had the lowest retake rates
- Where time-to-diagnosis was shortest and why
Those lessons can guide next year’s plans: equipment upgrades, staff training paths, scheduling templates, and even marketing themes that highlight services where imaging already shows strong acceptance and clean follow-through.
FAQs Dentists Ask About Imaging-to-Treatment KPIs
How do I actually link my images to treatment plans so I can track case acceptance?
To link images to plans, each system needs consistent identifiers. Every image should carry patient ID, capture date, tooth or region, and provider. Your PMS or analytics layer then has to join that record to the visit’s treatment plan and accepted procedures. This usually needs either native dental imaging software integration or a data layer that can join imaging logs, chart notes, and treatment codes into one record per visit.
What is a good imaging retake rate for a general dentistry practice?
There is no single perfect number for every office. Many general practices aim for retake rates in the low single digits for routine intraoral images, but the right target depends on your case mix and hardware. The key is to measure retakes by modality, provider, and room, then watch trends. Once outliers are clear, you can focus training and workflow changes on the highest impact areas.
How can The Dental App help me measure imaging-to-treatment conversion?
The Dental App is a cloud-based practice management platform that connects imaging, PMS, EHR, and billing data for dental groups that want a shared source of truth. Because these data sit in one connected environment, you can calculate imaging-linked case acceptance, retake rate, and time-to-diagnosis by provider, location, or modality. The Dental App also normalizes codes and names across sites, so KPIs are comparable and useful for training and planning.
Do I need new imaging hardware to get better KPIs?
Most practices do not need new devices just to improve imaging KPIs. Bigger gains usually come from better data integration and clearer workflows. As long as your current tools can export logs with timestamps and patient IDs, a connected platform can often build the links you need. Once your KPIs are visible, you can make a more confident decision about when hardware upgrades are truly needed.
How quickly should imaging-related changes show up in my financials?
If you improve imaging-linked case acceptance, retake rates, or time-to-diagnosis, you can often see early financial effects within one to three months, depending on your billing cycle. More accepted imaging-supported treatment can add up to around $40K per month in extra revenue for some groups, while fewer retakes and clearer documentation support 33% faster claims and 17% more claims processed. The important step is to track both clinical KPIs and financial outcomes in the same reporting environment so cause and effect are clear.
How should our group get started with imaging KPIs without building a data team?
Start with a simple 90-day focus. First, define a small set of KPIs: imaging-linked case acceptance, retake rate, and time-to-diagnosis. Next, inventory which of your current systems already capture the needed fields and where the gaps are. Then choose an integration strategy, whether that is better PMS reporting, a data warehouse, or a connected platform like The Dental App. From there, review imaging KPIs in monthly leadership meetings and connect them to real workflow changes, not just reports.
Streamline Your Imaging Workflow For Faster, Clearer Dentistry
If you are ready to connect your tools and eliminate manual work, explore how our dental imaging software integration can simplify your daily workflow. At The Dental App, we focus on making your existing systems work together so your team can spend more time on patient care and less on clicking through software. We will work with you to design an integration approach that fits your practice size, imaging devices, and goals. Have questions about where to start or what’s possible for your setup, just contact us and our team will walk you through your options.